by our staff writers
August 7, 2013
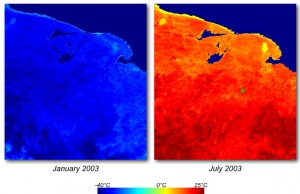
The region around Kytalyk is characterized by some of the World’s strongest spatial gradients. Most conspicuous is the temperature gradient. The northern part of the region borders the Siberian Sea and is more temperate than the inland, although it is still extreme compared to our sense of temperate. The figure below is a satellite-based land-surface temperature map that illustrates how, in winter (left), temperatures drop to minus 40 degrees in the south to ‘only’ about minus 20 degrees at the coast: a gradient over a distance of less than 300 km. In summer (right), this gradient is inverted, thus amplifying differences between the regions. The field team is in the bright red region (green dot in the summer map) and therefore temperature seems no concern at the moment. Reality, however, is not always as it should be (see blog post “the weather in Kytalyk this summer“).

Land-surface temperature from MODIS sensor (Source: https://lpdaac.usgs.gov/products/modis_products_table/mod11a2).

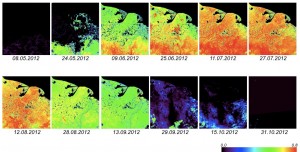
Series of MODIS NDVI images for the 2011 growing season (Source: https://lpdaac.usgs.gov/products/modis_products_table/mod13a1).
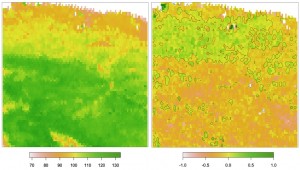
Despite this time-constraint (another one) of a short growing season, the arctic tundra plays an important role in the world’s carbon budget. Per unit area, it sequesters about a third of the yearly amount of carbon compared to forests, but in a very short time. The changes in the carbon budget with changes in climate may therefore be substantial and it is important to closely monitor variations in the growing season. Land-surface phenology is the study of these intra-annual dynamics and nowadays, we have more than 30 years of global NDVI data available for this purpose. Irene Garonna, a PhD student in remote sensing and affiliated to the Global Change and Biodiversity URPP, focuses on this type of vegetation dynamics. A quick look into her analyses tells us how the growing season varies spatially and how it changes over time. The figures below look different from the previous ones, because they are based on other satellite sensors with a coarser resolution (8×8 km, as opposed to 0.5×0.5 km) and they have a different projection (degrees instead of UTM). Nevertheless, the region is the same and from the map on the left, we can clearly distinguish the same coast-to-inland gradient as we saw before, but this time in length of growing season (number of days per year, 30-year average). The shorter growing seasons are in the north, where snowmelt starts later in the year (see the radar blog of July 25th). The map at the right, however, depicts the change in length of growing season over the past 30 years and indicates a lengthening of about 1 day/year in these northern areas. This might be linked to warming conditions in the arctic and a possible retreat of the sea ice. These and other effects along latitudinal gradients are research topics of the URPP.

Left: average length of growing season (days). Right: corresponding temporal changes (days/year). Both are based on 1982-2011 data. (Source: http://www.mdpi.com/journal/remotesensing/special_issues/monitoring_global)
