This post is also available in:
 Deutsch
Author Impact Beamplots present a new visualization tool in Web of Science. They showcase the range of a researcher’s publication and citation impact in a single data exhibit.
Beamplots make use of field-normalized citation metrics (percentiles). They put the citation counts in a larger context. Furthermore, they do not unduly penalize those with gaps in the publication record or those who work in fields with distinctly different publication activity. Beamplots allow you to verily compare author performance even across subject categories.
As the Author Impact Beamplot is more a profile than a metric, it should be considered in academic appointments, promotions, and funding decisions.
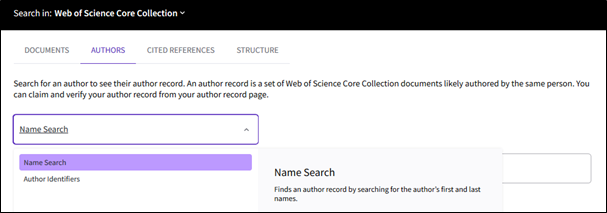
How to read a beamplot?

Each dot on the beamplot represents a publication. In each year, the green circle is the median percentile value for publications in that year, and the overall average is shown using a vertical dotted line. A score of 90 means that the paper is among the top 10% most cited publications. A score over 50 indicates above-average citation performance.
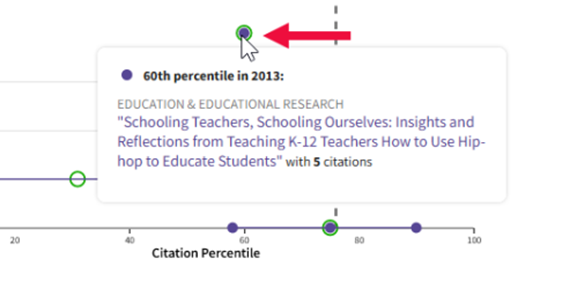
When hovering over the elements of the beamplot, one can see article, citation and percentile information and click through to view the full data set.
More Information Interpreting the citation performance of individual researchers with beamplots
The introduction of filed-normalized percentiles to measure citation impact is a crucial aspect of beamplots that addresses many criticisms of the h-index relating to comparability across disciplines and biases to portfolio size and continuity.
