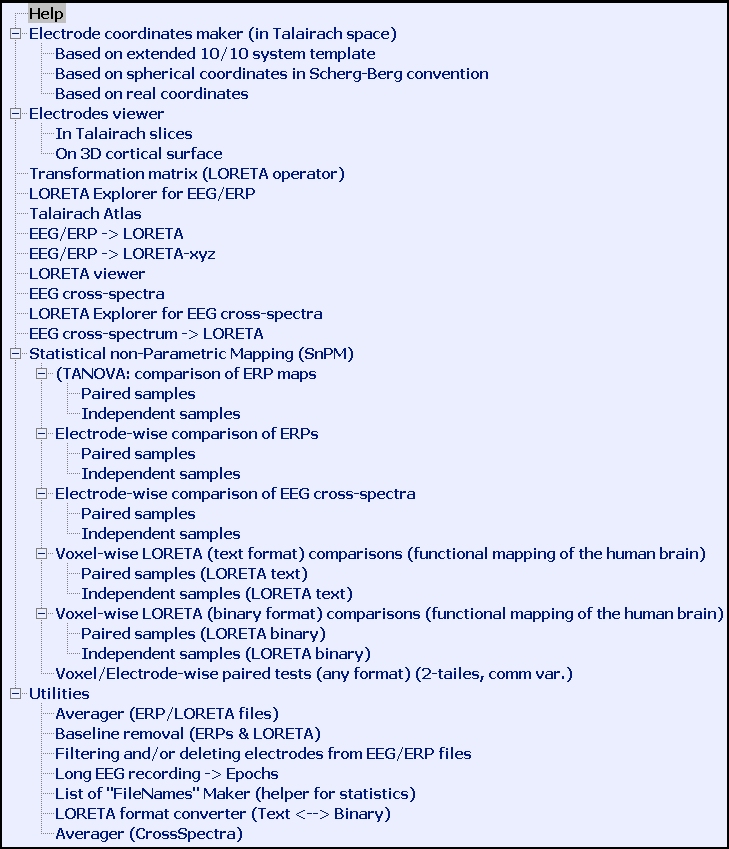
These are the
options available when you run LORETA:
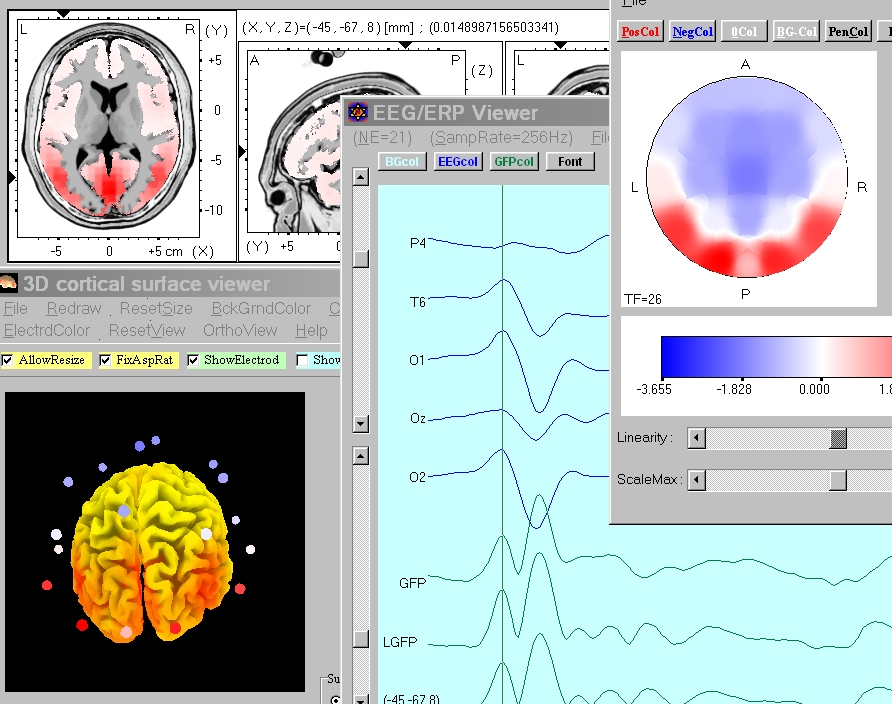
For instance,
you can "explore" an ERP: from waveshapes, to scalp maps, to LORETA
(in Talairach slices and 3D cortical surface), and you can even virtually implant
electrodes that measure the electric neuronal activity:
However, functional localization inference is based on the statistical analysis of LORETA images. This is the typical approach in PET and fMRI. In this package, you have a number of tools that allow you to perform bullet proof statistical analysis of your data.
For instance,
you can compare (statistically) EEG under different conditions, and localize
the generators of particular frequency components. In the paper:
slow and fast sleep spindles were found to be generated in distinct brain areas:
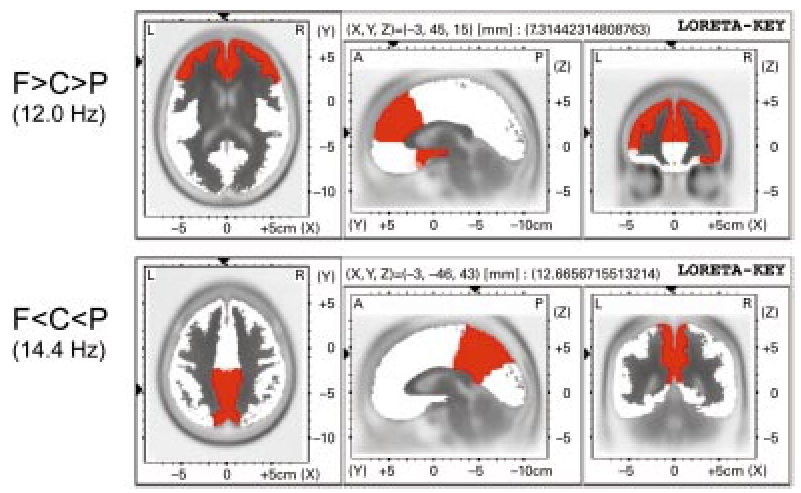
As another example,
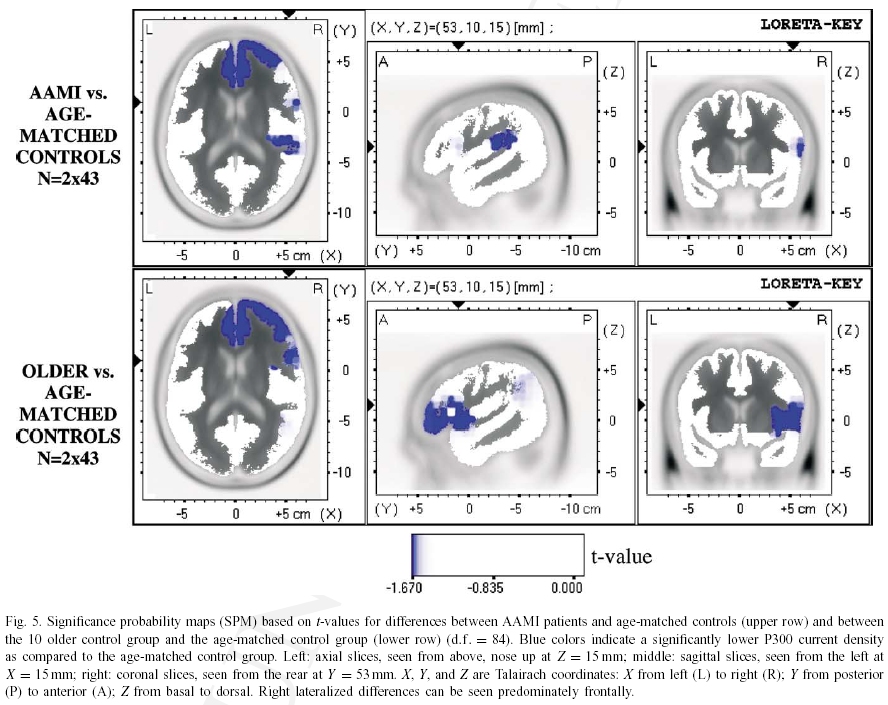
in an auditory P300 ERP experiment:
statistical comparisons of the P300-electric neuronal generators between age-associated
memory impairment (AAMI) and age-matched controls, and between an older control
group and the age-matched controls, resulted in: