LORETA / sLORETA / eLORETA
LORETA: low resolution electromagnetic tomography (1993, 1994)
sLORETA: standardized low resolution electromagnetic tomography (2002)
eLORETA: exact low resolution electromagnetic tomography (2007, 2011)
Comparing sLORETA and eLORETA to almost all other 3D discrete linear tomographies from the literature (2018)
Old LORETA homepage for lots of information
Recent LORETA homepage, loaded with information
Why LORETA?
Quantitative analyses of brain electric activity rely on the development
of innovative models and methods that must minimally satisfy, if possible, two
criteria:
(1) Validation, if experimental ground truth is available.
(2) Best performance, based on fair, objective comparisons to other
similar published methods, using simulations.
These methods deal with the EEG/MEG neuroimaging problem: given measurements of scalp electric potential differences (EEG: electroencephalogram) and extracranial magnetic fields (MEG: magnetoencephalogram), find the 3D distribution of the generating electric neuronal activity.
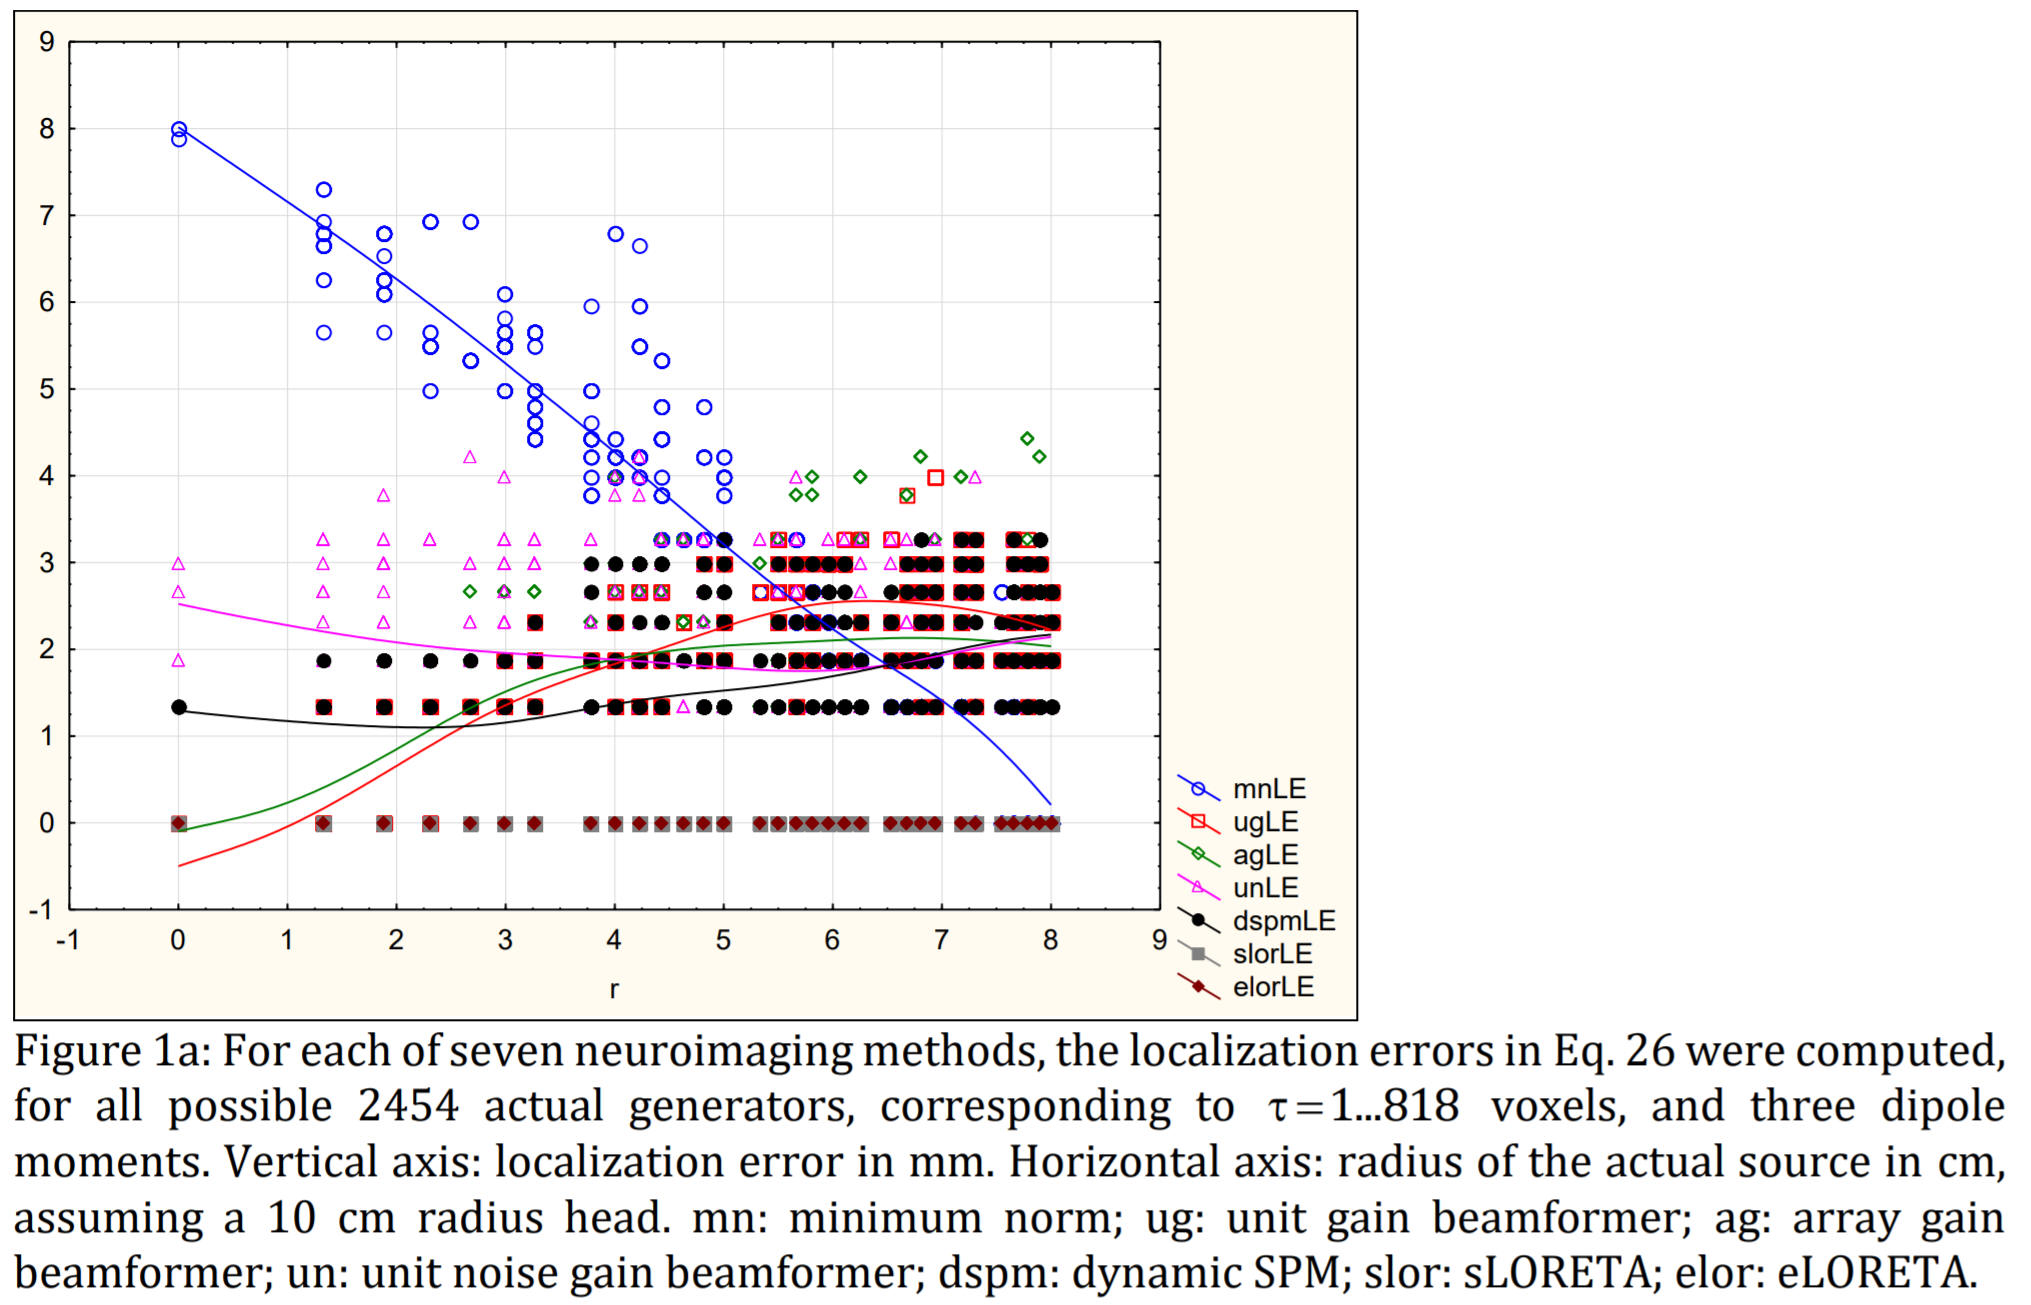
Consider the family of linear 3D distributed inverse solutions. And consider the localization error to a point test source anywhere in the solution space. Then, an inverse solution is unreliable if it has localization error to point sources. In other words, an inverse solution is unreliable if it has localization bias.
This is very important, since imaging is all about localization. Mislocalization is unacceptable.
LORETA (1993, 1994) has localization bias, albeit small.
sLORETA and eLORETA have zero localization error to point sources.
Here is a comparison of a large family of linear inverse solutions: https://doi.org/10.1101/269753
The abstract for the comparative study follows:
EEG/MEG neuroimaging consists of estimating the cortical distribution of time varying signals of electric neuronal activity, for the study of functional localization and connectivity. Currently, many different imaging methods are being used, with very different capabilities of correct localization of activity and of correct localization of connectivity. The aim here is to provide a guideline for choosing the best (i.e. least bad) imaging method. This first study is limited to the comparison of the following methods for EEG signals: sLORETA and eLORETA (standardized and exact low resolution electromagnetic tomography), MNE (minimum norm estimate), dSPM (dynamic statistical parametric mapping), and LCMVBs (linearly constrained minimum variance beamformers). These methods are linear, except for the LCMVBs that make use of the quadratic EEG covariances. To achieve a fair comparison, it is assumed here that the generators are independent and widely distributed (i.e. not few in number), giving a well-defined theoretical population EEG covariance matrix for use with the LCMVBs. Measures of localization error, false positive activity, and false positive connectivity are defined and computed under ideal no-noise conditions. It is empirically shown with extensive simulations that: (1) MNE, dSPM, and all LCMVBs are in general incapable of correct localization, while sLORETA and eLORETA have exact (zero-error) localization; (2) the brain volume with false positive activity is significantly larger for MN, dSPM, and all LCMVBs, as compared to sLORETA and eLORETA; and (3) the number of false positive connections is significantly larger for MN, dSPM, all LCMVBs, and sLORETA, as compared to eLORETA. Non-vague and fully detailed equations are given. PASCAL program codes and data files are available. It is noted that the results reported here do not apply to the LCMVBs based on EEG covariance matrices generated from extremely few generators, such as only one or two independent point sources.