Co-author networks at UZH
Read this post in
 Deutsch
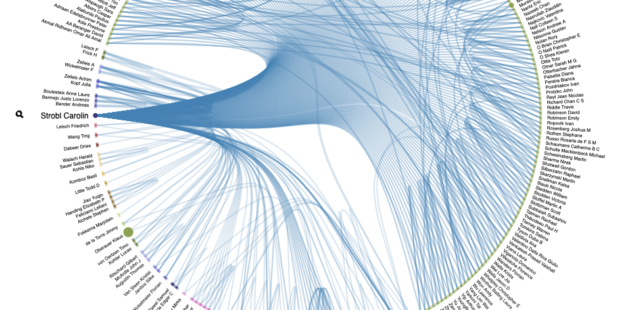
The fact that scientists at the University of Zurich are increasingly conducting their research in a collaborative and transnational manner finds expression in wide-ranging author networks. In the ZORA repository, these are visible and explorable thanks to impressive visualization options.
Research projects, especially in the natural and life sciences, have become so complex in recent years that they require collaboration across multiple, often large and internationally distributed teams. This is reflected accordingly in the number of authors of publications.
While the average number of authors for UZH scientific articles in ZORA was still 5.5 persons/article in 2012, the average has already grown to 7.5 persons/article 10 years later.1 Currently, ZORA has over 178,000 publications with about 887,000 personal names.
Collaborations can be explored in ZORA
Collaborations of UZH researchers can be explored directly in ZORA by searching for a name under Authors & Editors and then clicking on the link “Co-authors”, or by selecting a name in a detailed view of an article under “Authors, Institutions, Networks”.
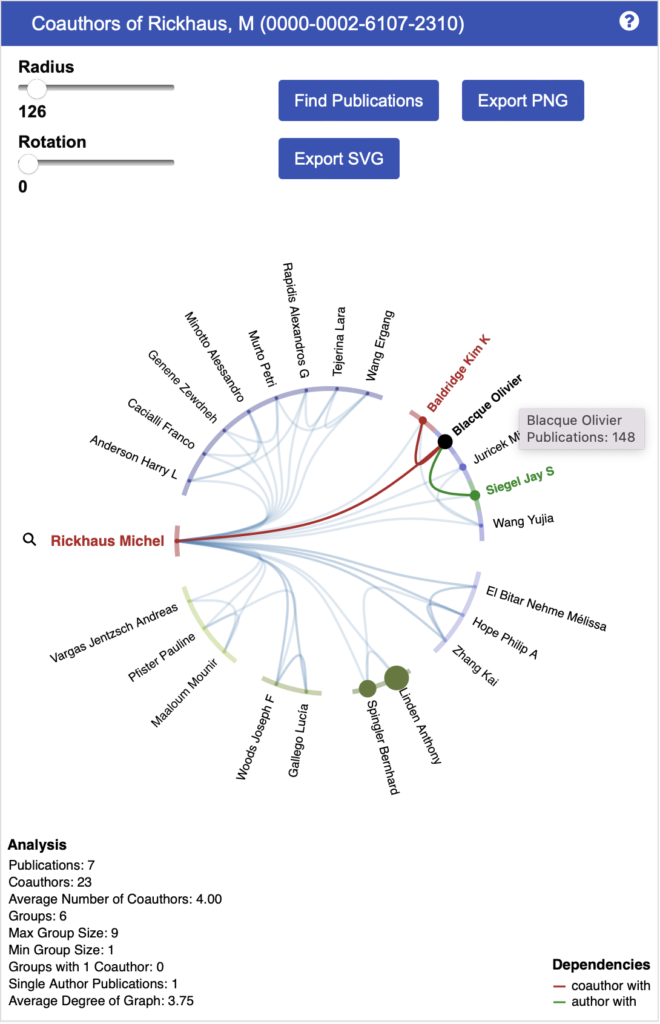
The diagram then displayed (example below or directly here) shows the following relationships:
- Authors with whom the selected person has published a certain number of joint publications each form a group. They are arranged on a bar and have the same color.
- Important (co-)authors are indicated by the size of the dot, proportional to the number of their publications.
- Connecting lines indicate collaborations. To avoid a cluttered graph, not all pairwise collaborations within a group are shown, but only adjacent ones. The thickness of the line is a measure of the number of joint publications of the selected author with a group.
- An analysis completes the diagram with information on the total and average number of co-authors, group count and size, and other parameters.
The diagram is interactive and can be explored with the mouse (zoom, rotate, drag, mouse hover, click on name).

ORCID iD brings higher visibility
An important tool for consolidating different name spellings of an author is the ORCID iD. For researchers, the use of ORCID iD brings many advantages: Higher visibility of one’s publication output, clear attribution of authorship (also in collaborations), improved networking in scientific publishing and easier data exchange between systems.
Therefore, about 1500 UZH members have already linked their ORCID iD with ZORA and marked their publications with the ORCID iD (instructions). From the publication data in ZORA, we see a large potential for several hundred more UZH members to do so.
About the technology
The visualizations of author collaborations (ZI-Blog) already introduced in ZORA in 2016 have been replaced by a more powerful technology. They are now built on a combination of the Elasticsearch search engine with the Vega visualization grammar. Elasticsearch is already successfully used in ZORA search (ZI-Blog) and for the UZH Open Access Monitor (ZI-Blog).
For the visualizations, Elasticsearch was used to create a name index with about 279,000 unique name mappings and a collaboration index with about 173,000 groups of people’s names. When adding a publication to ZORA, these indexes are updated automatically.
Vega is a declarative language for visualization design developed at the Stanford Visualization Lab and the University of Washington. Because it greatly simplifies the interactive visualization of JSON data for the developer and end-user, it is also used in Wikipedia and many third-party applications for interactive diagrams.
In ZORA, the combination of Vega and Elasticsearch enables a high-performance application over a large dataset: querying, preparing the data, and rendering the scalable vector graphics all take place in a fraction of a second. The so-called edge-bundling algorithm2 is used to render the network of collaborations.
Notes
- These average figures are even too low because for editorial reasons the maximum number of names is limited to 30.
- D. Holten, IEEE Transactions on Visualization and Computer Graphics 12 (5) (2006), 741, https://doi.org/10.1109/TVCG.2006.147.
Martin Brändle, Zentrale Informatik & Open Science Services UB

Comments are closed, but trackbacks and pingbacks are open.